Plotting n sided star using Graphical Interface
 Star.cpp
#include "Graph.h"
#include "Star.h"
#include <cmath>
#include <iostream>


const double PI = atan(1) * 4;

namespace Graph_lib {
	Star::Star(Point center, int n, int w, int len) {
		// outer circle
		std::vector<Point> out;
		std::vector<Point> in;


		for (int i = 0; i < n; i++)
			out.push_back({
			  center.x + int(len * cos(float(2 * PI * i) / n)),
			  center.y - int(len * sin(float(2 * PI * i) / n))
			});

		for (int i = 0; i < n; i++) {
			const double angle = float(2 * PI * i) / n;
			in.push_back({
			  center.x + int(w * cos(angle + PI/float(n))),
			  center.y - int(w * sin(angle + PI / float(n)))
			});
		}

		for (int i = 0; i < n; i++) {
			std::cout << out[i] << in[i];
			add(out[i]);
			add(in[i]);
		}
	}
};
Main.cpp
#include <stdexcept>
#include <string>
#include <vector>
#include "Simple_window.h"
#include "Graph.h"
#include "Star.h"

int main() {
	using namespace  Graph_lib;
	Graph_lib::Point tl{ 100, 100 }; // top left corner. Window position on screen
	Simple_window win{ tl, 600, 400, "Canvas" };

	Graph_lib::Star star{ {300, 200}, 100, 100, 200};
	star.set_fill_color(Color::cyan);
	win.attach(star);

	win.set_label("Canvas");
	win.wait_for_button(); // display to screen
}
Results:
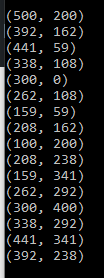
Points
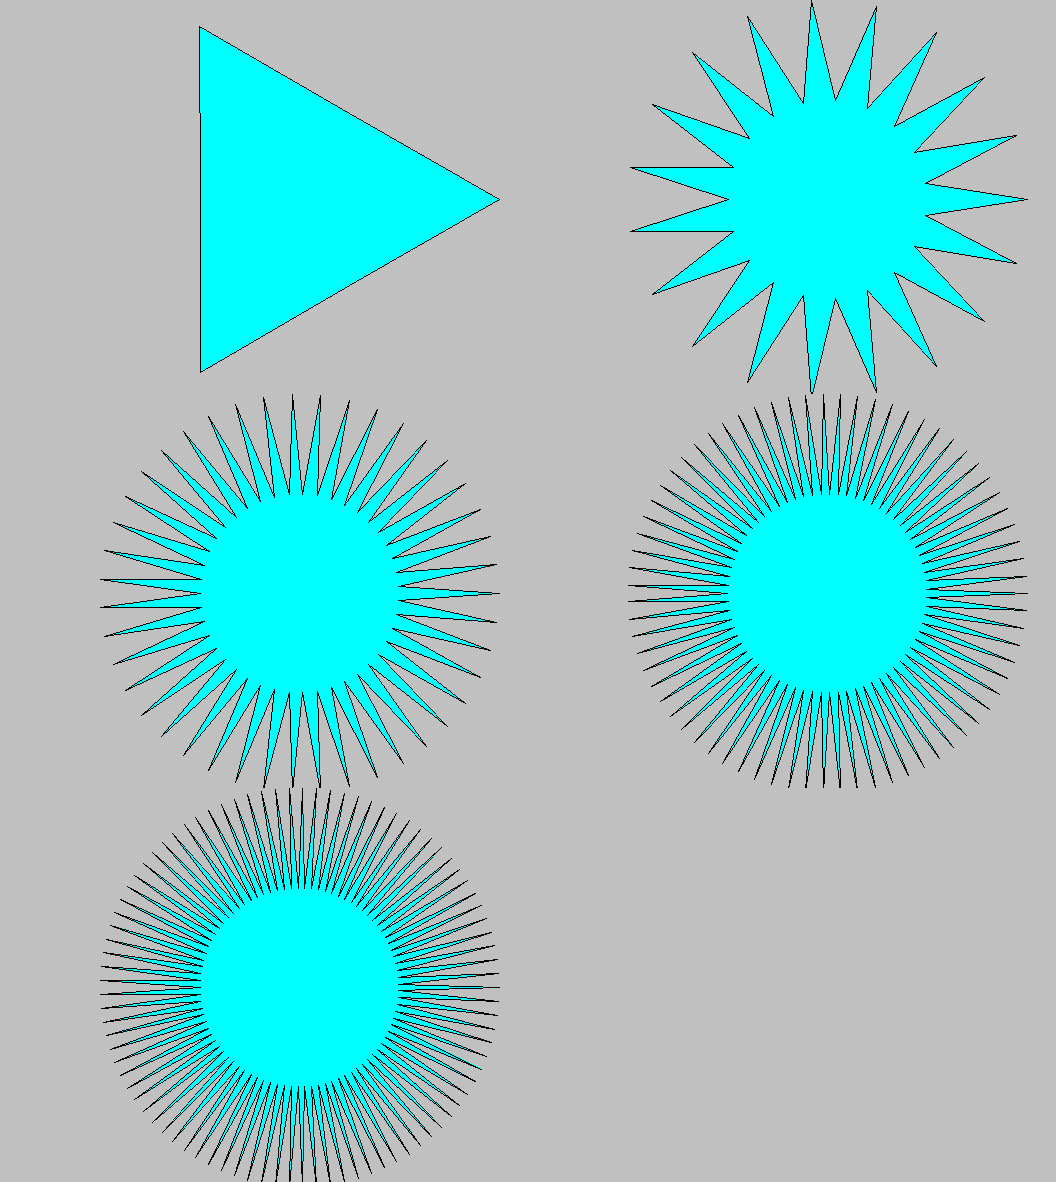
0 to nth generation
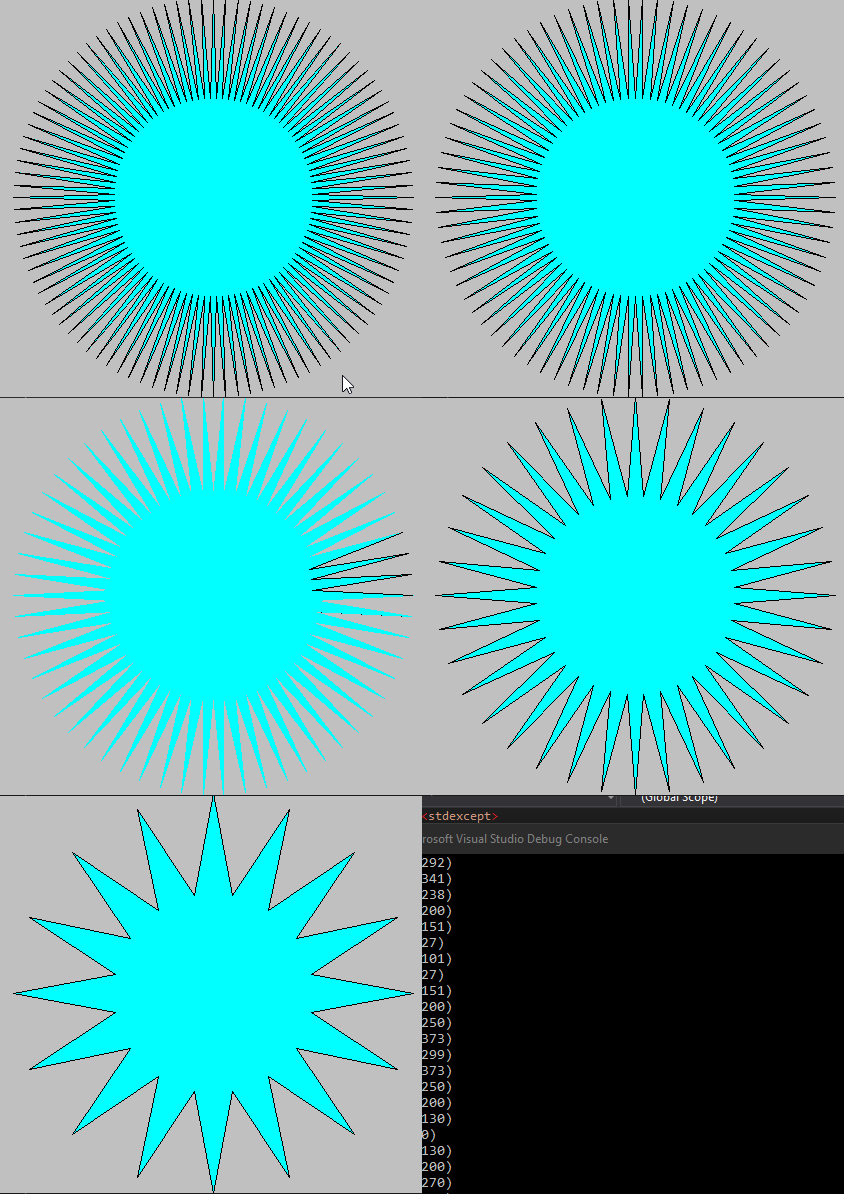
Nth to 0th Generation
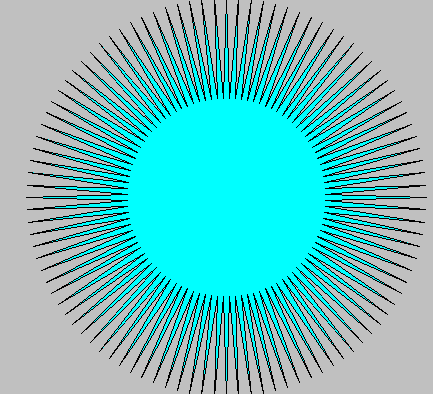
100 sided star
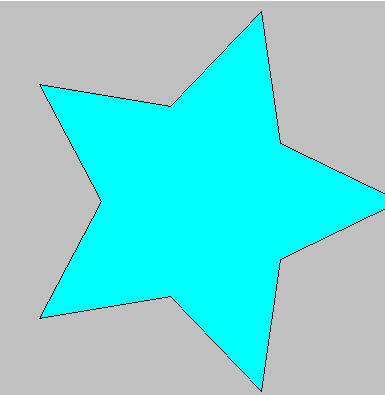
5 sided star


